Boasting a distinguished heritage of innovative breakthroughs and a consistent record of financial success, Michelin has firmly established itself as a pioneer in the tire business. Yet, what drives their steadfast appeal and achievements? By examining historical data, financial performance, environmental initiatives, and other relevant data, Rerev has successfully created a valuable resource that offers a holistic view of Michelin Tires. This all-encompassing study delves into the factors that have contributed to the company’s success, as well as the challenges and opportunities it faces in the ever-evolving tire industry.
- Michelin is the largest tire manufacturer in the world, with a market share of around 14.8%.
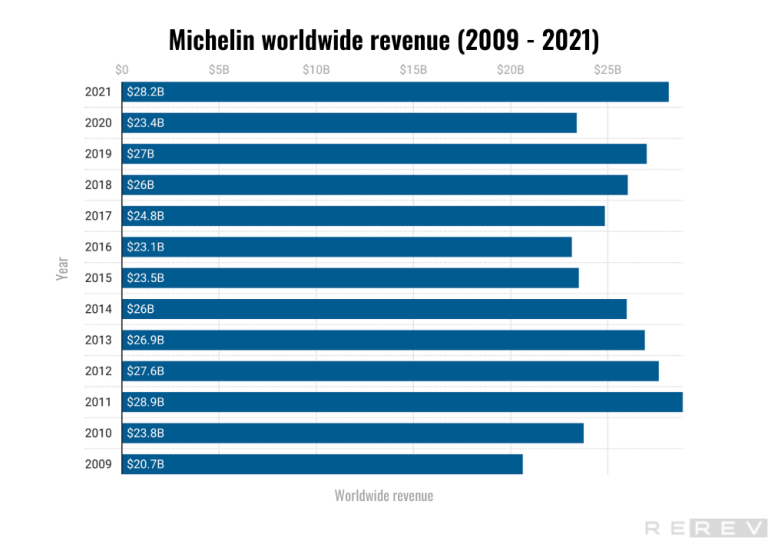
- The worldwide revenue of Michelin increased by approximately $7.5 billion starting from 2009, indicating continuous growth in the market.
- The percentage of women in Michelin’s workforce has increased gradually from 17.50% to 19.80%.
- Europe is the largest market for Michelin, accounting for around 37-39% of sales.
Table of contents
Michelin history timeline
On May 28, 1889, Michelin was incorporated.
Michelin patented its first removable pneumatic tire.
The United States Rubber Company, later known as Uniroyal, Inc., was founded and eventually acquired by Michelin.
Michelin broke the world speed record just four years after inventing the car tire.
Michelin launched its UK operation and expanded to Italy the following year.
The company acquired rubber plantations in Indo-China.
Michelin began publishing road maps, creating the first maps of France specifically designed for motorists.
Michelin launched the Roulement Universel, also known as the all-purpose tire, featuring molded treads.
Michelin initiated the practice of bestowing stars upon exceptional dining venues.
Michelin was the 17th largest tire vendor in the world.
At the onset of war, Michelin supplied official maps for the French military, and over two million were disseminated to the liberation forces in 1944.
Michelin pioneered the introduction of steel-belted radial tires, becoming the first to do so.
30 million X-tires were being produced annually at a rapid pace on the assembly lines.
Michelin brought radial tire technology to Formula One and secured a victory in the Formula One Drivers’ Championship.
The company enhanced not only its car tires but also its heavy vehicle tire offerings.
Michelin has reclaimed its position as the world’s top tire manufacturer after spending two years in second place behind Bridgestone.
Starting from 2014, electric vehicles have been competing on Michelin tires in the Formula E single-seater street racing championship.
Michelin worldwide revenue statistics
- Michelin’s revenue has been consistently increasing over the past decade despite market fluctuations and challenges in 2020.
Michelin’s worldwide revenue has generally increased over the years, despite some fluctuations. The lowest point occurred in 2009, with revenue at $20.65 billion, while the highest revenue came in at $28.86 billion in 2011. Although 2020 saw a decline in revenue to $23.38 billion, likely due to the global pandemic’s impact, the company managed to bounce back in 2021 with a revenue of $28.15 billion. Overall, Michelin’s revenue growth demonstrates the company’s resilience and adaptability in the face of changing market conditions and challenges within the tire industry.
Michelin gross profit statistics
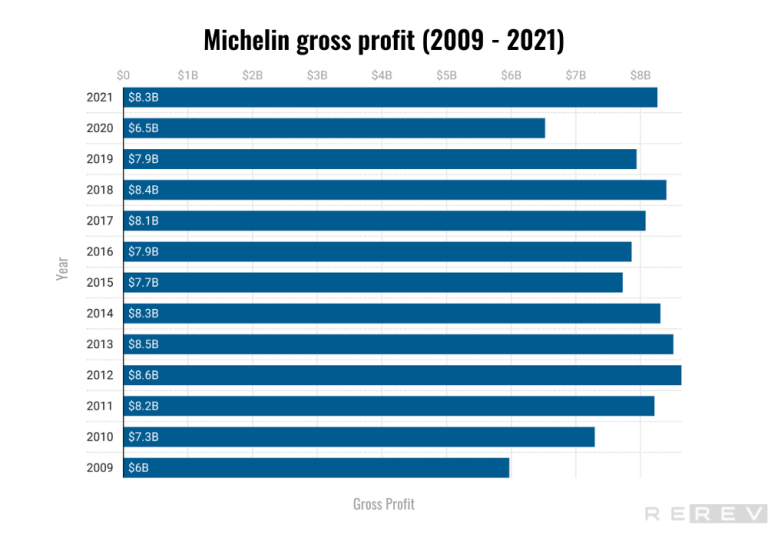
- Michelin’s annual gross profit increased by approximately 38% from 2009 to 2021, demonstrating the company’s financial growth and stability in the tire industry.
Michelin has experienced significant growth in its annual gross profit over the years, with a few fluctuations between specific years. For instance, between 2009 and 2021, the company’s gross profit increased by about 38%. Notably, there was a dip in gross profit in 2020, which reached USD 6.53 billion, likely due to the global pandemic’s impact on the industry. However, Michelin rebounded in 2021 with a gross profit of USD 8.26 billion. This consistent growth in gross profit highlights Michelin’s ability to adapt to market conditions and maintain profitability.
Michelin operating profit statistics
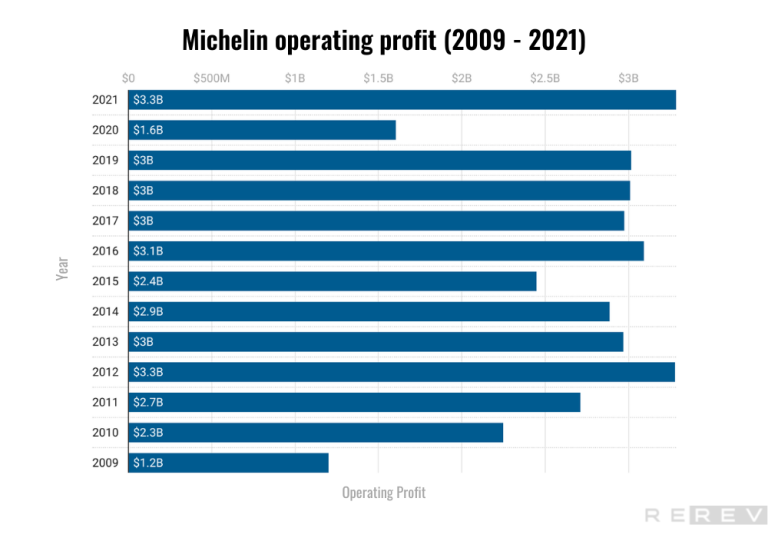
- Michelin’s annual operating income more than doubled from USD 1.2 billion in 2009 to USD 3.29 billion in 2021, showcasing the company’s ability to improve its operational efficiency and profitability consistently.
Michelin has experienced a steady increase in its annual operating income over the years. From 2009 to 2021, the company’s operating income grew from USD 1.2 billion to USD 3.29 billion, which is more than a two-fold increase. Despite experiencing some fluctuations, such as a dip in operating income in 2020 to USD 1.6 billion, likely due to the global pandemic, Michelin managed to recover in 2021 with a significant increase in operating income. This consistent growth in operating income highlights the company’s ability to enhance its operational efficiency and maintain strong profitability.
Michelin net income statistics
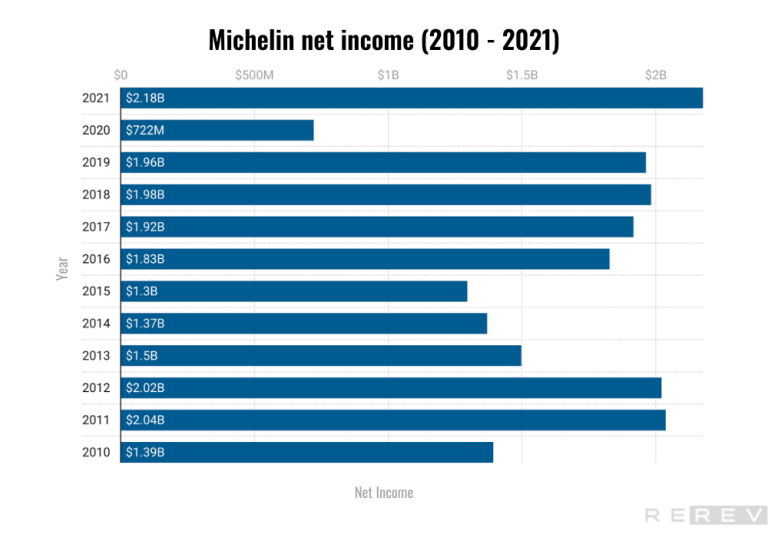
- Michelin’s annual net income increased by approximately 56% from 2010 to 2021, with a notable dip in 2020 due to the COVID-19 pandemic.
Michelin has experienced considerable growth in its annual net income over the years, despite a few fluctuations between certain years. For example, from 2010 to 2021, the company’s net income increased by about 56%. There was a significant drop in net income in 2020, reaching only USD 722 million, likely due to the impact of the global pandemic on the industry. However, Michelin bounced back in 2021 with a net income of USD 2.18 billion. This consistent growth in net income underscores Michelin’s ability to adapt to market conditions, maintain profitability, and reinforce its position as a leading tire manufacturer.
Michelin ownership structure
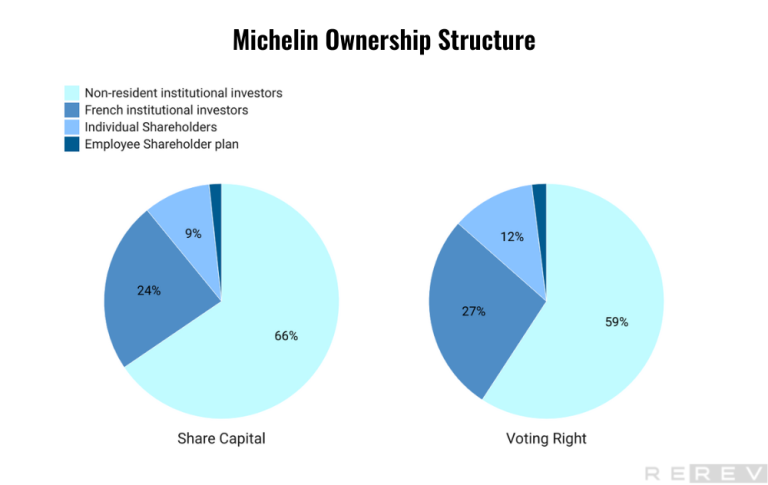
- Non-resident institutional investors hold most of Michelin’s share capital and voting rights, accounting for 65.5% and 59.2%, respectively.
Michelin’s ownership structure demonstrates that non-resident institutional investors are the largest stakeholders, holding 65.5% of the share capital and 59.2% of the voting rights. This suggests that there is considerable international interest and confidence in Michelin as an investment opportunity. French institutional investors are the second-largest group, with 23.6% share capital and 27.3% voting rights. Individual shareholders and employee shareholder plans hold smaller portions, with 9.2% and 1.7% of share capital and 11.5% and 2% of voting rights, respectively. The diverse ownership structure reflects Michelin’s broad appeal to various investors and its strong position within the tire manufacturing industry.
Michelin EPS statistics
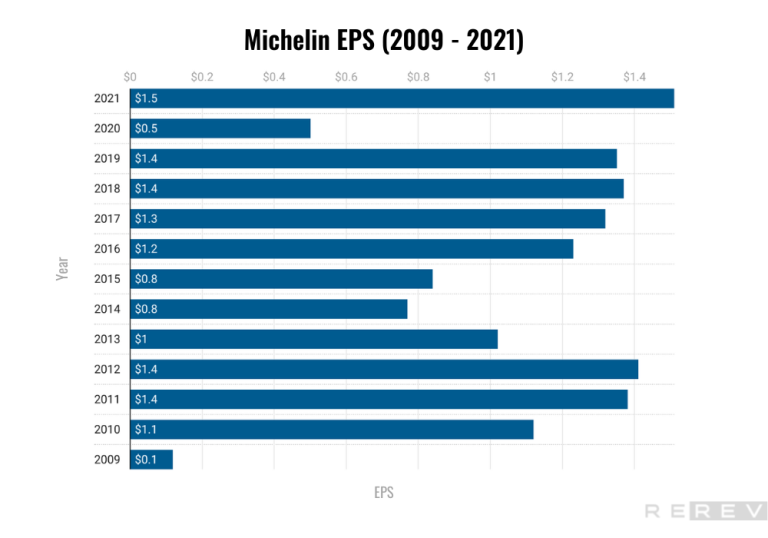
- Michelin’s annual EPS has shown consistent improvement between 2015 and 2021, with a notable dip in 2020 due to the COVID-19 pandemic
Michelin’s annual EPS data reveals a steady upward trend from 2009 to 2021, indicating the company’s robust financial performance and increasing value for its shareholders. Starting with an EPS of 0.12 in 2009, the company experienced remarkable growth, reaching an EPS of 1.51 in 2021. This growth is particularly noteworthy between 2015 and 2021, as the EPS increased from 0.84 to 1.51 during this period. The consistent improvement in EPS can be attributed to Michelin’s strong market position, effective business strategies, and its ability to adapt to changing market conditions.
Michelin sales by region statistics
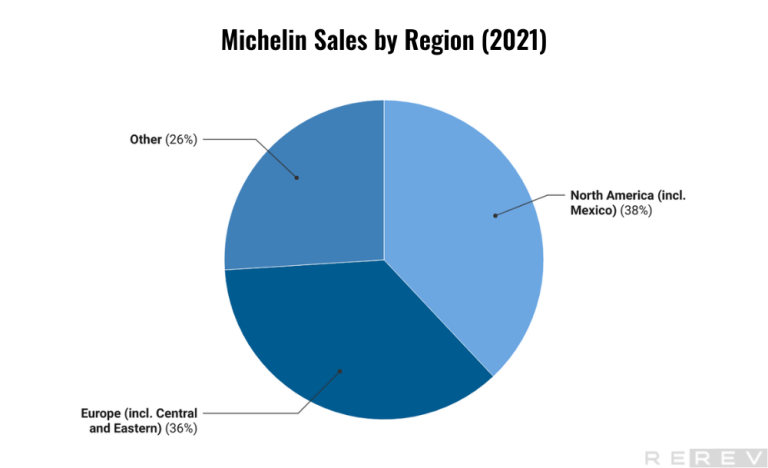
- Michelin’s sales by region indicate a well-balanced distribution of revenue, with Europe and North America consistently contributing the majority of sales, showcasing the company’s strong market presence in these key regions.
Michelin’s sales by region data from 2017 to 2022 highlights a well-balanced distribution of revenue across Europe, North America, and other regions. Europe, including Central and Eastern Europe, consistently contributes the highest percentage of sales, ranging from 36% to 39% during this period. North America, including Mexico, closely follows, accounting for 35% to 38% of the sales. The remaining sales come from other regions, contributing 25% to 28% of the total revenue.
This balanced distribution of sales demonstrates Michelin’s strong market presence in key regions like Europe and North America, as well as its ability to maintain a diverse customer base across the globe.
Michelin’s current ratio statistics
- Michelin’s current ratio has generally been above 1 over the past decade.
In the realm of financial stability, Michelin’s journey was marked by its impressive current ratio, showcasing the company’s ability to meet its short-term obligations. Between 2009 and 2022, Michelin’s current ratio experienced a range of fluctuations yet always remained above 1, signaling a strong position in terms of liquidity. The current ratio, calculated as current assets divided by current liabilities, has consistently remained above 1.4 throughout the period, with the highest ratio recorded at 2.07 in June 2012 and the lowest at 1.4 in June 2018.
This consistently positive current ratio suggests that Michelin has been able to effectively manage its working capital and ensure that its short-term obligations are adequately covered.
Michelin reporting segments statistics
- Michelin has three distinct business segments: Automotive and Related Distribution, Road Transportation and Related Distribution, and Specialty Businesses and Related Distribution.
Michelin’s financial performance across its three business segments – Automotive, Road Transportation, and Specialty Businesses – demonstrates varying levels of success and profitability. The automotive segment witnessed a sharp recovery in 2021, with an impressive 13.7% operating margin, up from just 8.3% in 2020. In 2022, the segment’s operating income continued to grow, though the margin slightly decreased to 12.1%.
The road transportation segment displayed a similar recovery pattern in 2021, with an operating margin of 9.6%, bouncing back from the 5.6% margin in 2020. However, in 2022, the segment’s operating margin declined to 8.6% while the operating income increased.
Lastly, the specialty businesses segment experienced a decrease in operating margins from 20.1% in 2018 to 8.6% in 2022. The segment’s operating income also declined from 2018 to 2022.
Michelin employee count statistics
- Michelin has consistently had a large number of full-time equivalent employees, which has increased from 106,600 in 2015 to 124,900 in 2022.
Michelin’s workforce has experienced consistent growth over the years, showcasing the company’s commitment to investing in its employees and expanding its operations. In 2015, Michelin employed 106,600 people, and by 2022, the number had increased to 124,900, reflecting a significant expansion in human resources.
While the number of employees dipped slightly in 2018 to 111,100, it quickly rebounded in 2019, reaching 121,300, and continued to grow in subsequent years despite the challenges of 2020. The steady increase in the workforce at Michelin indicates the company’s dedication to meeting the growing demand for its products and services, as well as its ability to adapt and thrive in a competitive market.
Michelin’s workforce by gender statistics
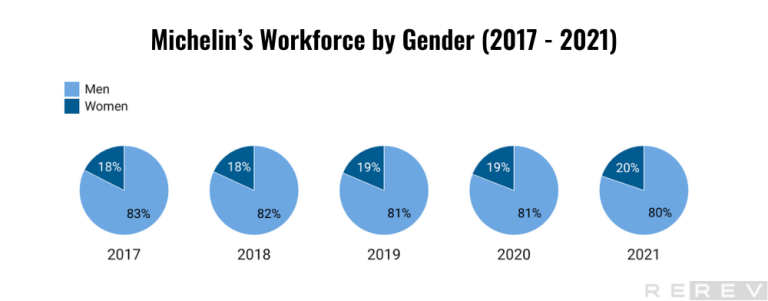
- There has been a steady increase in the percentage of women in Michelin’s workforce from 2017 to 2021.
Over the years, from 2017 to 2021, there has been a gradual increase in the representation of women in Michelin’s workforce. In 2017, women comprised 17.50% of the workforce, while men comprised 82.50%. By 2021, the percentage of women had risen to 19.80%, while the percentage of men had decreased to 80.20%. This trend indicates that Michelin is making progress in promoting gender diversity within its workforce.
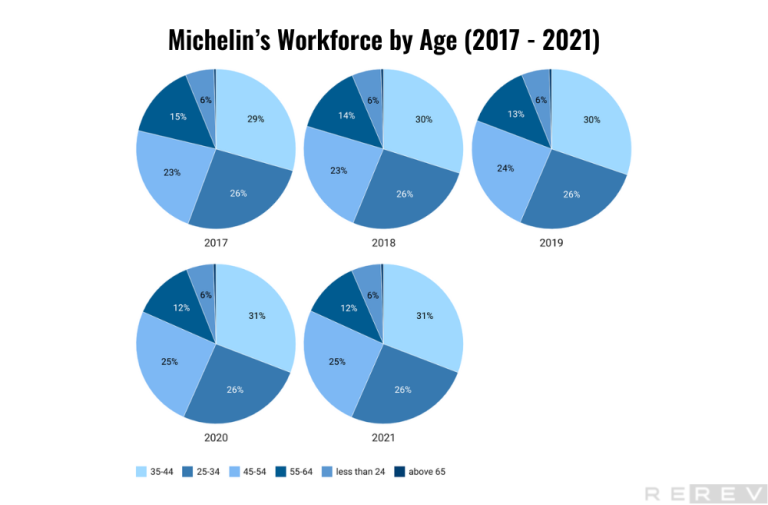
Michelin’s workforce by age statistics
- Michelin’s workforce has remained relatively stable from 2017 to 2021. The largest age group in the workforce is the 35-44 age group, comprising around 30% of the workforce each year.
From 2017 to 2021, most age categories have remained relatively stable over the years, with slight fluctuations. The most notable change is the decrease in the percentage of employees aged 55-64, which has consistently dropped from 15.10% in 2017 to 11.70% in 2021. Meanwhile, the percentage of employees aged less than 24 has increased from 5.80% to 6.00%, and the 45-54 age category has seen a rise from 23% to 25.20%. This suggests that Michelin’s workforce is gradually becoming younger, with a reduction in the proportion of employees nearing retirement age.
Michelin benefit costs statistics
- Employee benefit costs have increased from €6 billion in 2018 to €6,9 billion in 2022.
From 2018 to 2022, there has been a general upward trend in these costs, increasing from €6 billion in 2018 to €6,9 billion in 2022. However, there was a temporary decrease in 2020, when the costs dropped to €5,9 billion. This dip could be attributed to various factors, such as the global pandemic affecting operations and employment. Overall, Michelin has been investing more in employee benefits, indicating a commitment to employee welfare and satisfaction over the years.
Michelin’s strategy for 2030 statistics
- Michelin emphasizes employee engagement, safety, and customer satisfaction while striving to set new standards for diversity. The company is dedicated to driving progress in these areas and delivering exceptional customer experiences alongside quality products and services.
Aiming for an average annual growth rate of 5% between 2023 and 2030, with a return on capital employed (ROCE) exceeding 10.5%, Michelin plans to capitalize on the growing electric vehicle market and its superior offerings in specialty markets. The company also intends to expand its business beyond tires by providing services and solutions based on connected devices and data monetization.
Committed to reducing its environmental footprint, Michelin targets a 50% reduction in carbon emissions compared to 2010 levels and aims for carbon neutrality by 2050. Additionally, the company aspires to increase the percentage of bio-sourced or recycled materials in its tires as part of a circular economy approach.
Sources
- “Michelin: Results and Sales”. Michelin, https://www.michelin.com/en/finance/results-and-presentations/results-and-sales/
- “Michelin: Trends and Challenges”. Michelin, 2021, https://www.michelin.com/en/annual-report/trends-challenges/
- “Michelin: Profit”. Michelin, https://www.michelin.com/en/annual-report/performance-ambitions/profit/
- “Michelin 2021 DEU US.pdf”. Michelin, 2021, file:///C:/Users/loope/Downloads/Michelin_2021_DEU_US%20(1).pdf
- “Michelin: Research and Development Expenses”. Macro Trends, https://www.macrotrends.net/stocks/charts/MGDDY/michelin/research-development-expenses.
- “Michelin in Motion”. Michelin, 2021, https://www.michelin.com/en/annual-report/michelin-in-motion/
- “Michelin Annual Report”. Michelin, 2021, https://www.michelin.com/en/annual-report/
- “All Michelin’s Key Figures 2017-2021”. Michelin, 2021, https://www.michelin.com/en/documents/all-michelins-key-figures-2017-2021/
- “Passenger Car, Light Truck, Truck and Bus 2023 January Market”. Michelin, 2023, https://www.michelin.com/en/documents/passenger-car-light-truck-truck-and-bus-2023-january-market-2/
- “Michelin Group Annual Consensus Estimates”. Michelin, 2021, https://www.michelin.com/en/documents/annual-consensus-estimates-5/
- “Michelin Group Non-Financial Indicators 2021”.Michelin, 2021, https://www.michelin.com/en/documents/michelin-group-non-financial-indicators-2021/
- “The UN Sustainable Development Goals: Michelin’s Approach”. Michelin, 2021, https://www.michelin.com/en/documents/the-un-sustainable-development-goals-michelins-approach/
- “Michelin Financial Publications”. Michelin, https://www.michelin.com/en/finance/regulated-information/financial-publications/