With a storied history of innovation and a track record of financial success, Bridgestone has established itself as a leader in the tire industry. But what’s the secret to their enduring popularity and success? Dive deep into the world of Bridgestone Tires, exploring the company’s origins, its most impressive achievements, and the factors that have made it a household name among drivers worldwide. Whether you’re a tire enthusiast or just curious about the world of manufacturing, you won’t want to miss this insightful and engaging look at one of the industry’s most influential players.Following thorough research and analysis, Rerev’s team found that:
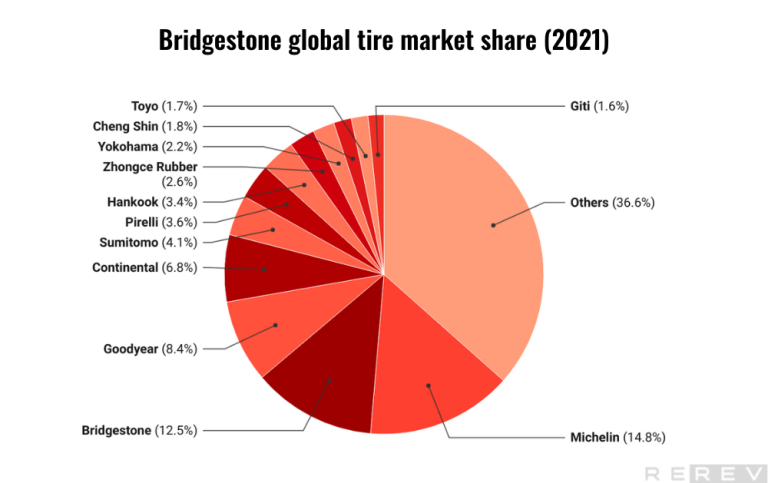
- Bridgestone is the second largest tire company in the global market after Michelin, with a market share of 12.5%.
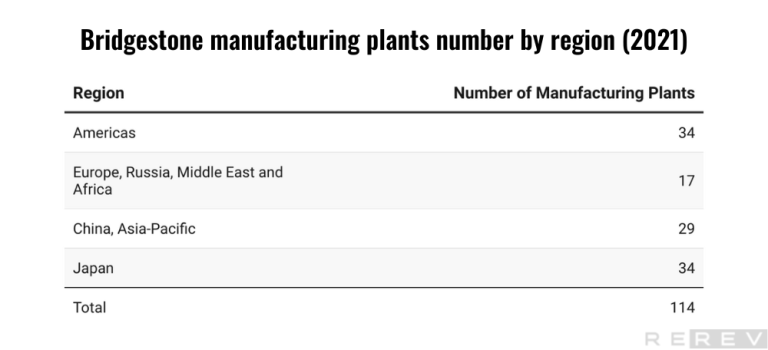
- Bridgestone operates a total of 114 manufacturing plants across the world.
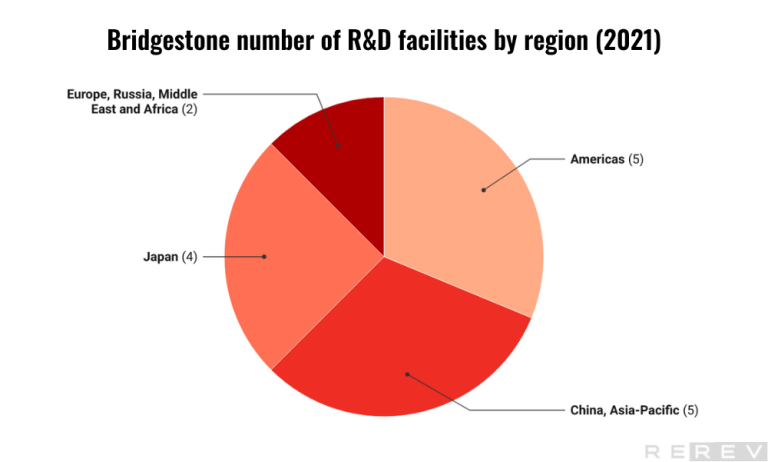
- Bridgestone has a global R&D network with facilities located in multiple regions worldwide. It operates a total of 16 R&D facilities globally.
- The highest regional production of tires is observed in the Americas, with a range of 560,000 to 600,000 tires produced.
Table of contents
Bridgestone history timeline
Bridgestone Tire Co., Ltd. was established in Kurume, Fukuoka Prefecture, Japan.
Bridgestone develops Japan’s first passenger vehicle radials.
Bridgestone announces successful development of Steel Rib tires, Japan’s first steel radials for truck and bus use.
Bridgestone develops Japan’s first passenger vehicle radials.
Bridgestone Tire Shop system launched in Japan.
Bridgestone Tire Company of America Ltd. was established to serve as the company’s U.S. sales headquarters in Los Angeles.
Bridgestone wins the Deming Application Prize.
Bridgestone merges Firestone Tire & Rubber Company, the second-largest US tire maker.
Bridgestone/Firestone Europe S.A. started sales and logistics operations in Europe.
Bridgestone participates in its first Formula 1® race.
Reconstruction of the disaster prevention system.
Bridgestone becomes Worldwide Olympic Partner.
Bridgestone becomes Worldwide Paralympic Partner.
Bridgestone worldwide revenue statistics
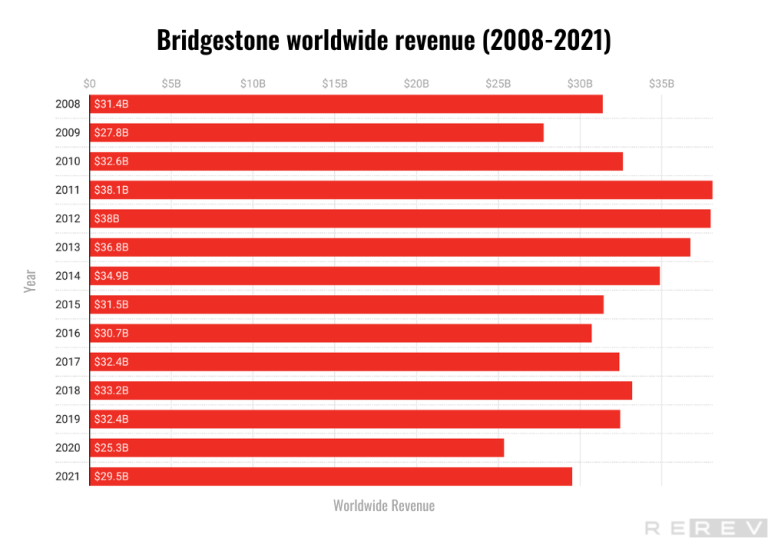
- Bridgestone’s worldwide revenue has fluctuated over the years, experiencing a significant decline in 2020. However, the revenue seems to be recovering afterward.
Bridgestone’s worldwide revenue had consistent growth from 2010 to 2013, with revenues peaking in 2011. However, a general downward trend followed until 2016, with a brief recovery in 2017 and 2018. The most notable decrease in revenue occurred in 2020, likely due to the impact of the global COVID-19 pandemic. In 2021, the revenue began to recover, but it has not yet reached pre-pandemic levels.
Bridgestone’s operating profit statistics
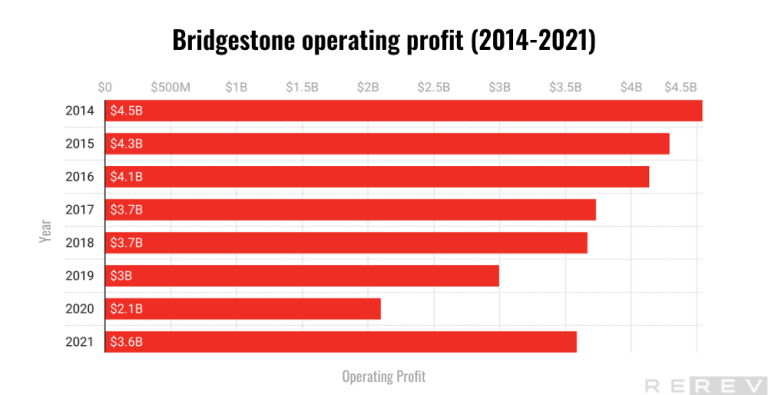
- Bridgestone’s operating profit has been volatile, with fluctuations over the years. The company’s operating profit had a general downward trend from 2014 to 2020 but showed a notable recovery in 2021.
Bridgestone’s operating profit experienced a general downward trend from 2014 to 2020. The decline in profit was not consistent, with minor fluctuations in between. The most significant drop occurred between 2019 and 2020, with the operating profit decreasing by almost 30%, likely due to the economic impact of the COVID-19 pandemic. However, there was a positive turnaround in 2021, as the operating profit increased by more than 70% compared to 2020. While the 2021 profit has not yet reached the levels seen in 2014-2016, the recovery is a promising sign for the company’s future performance.
Bridgestone net income statistics
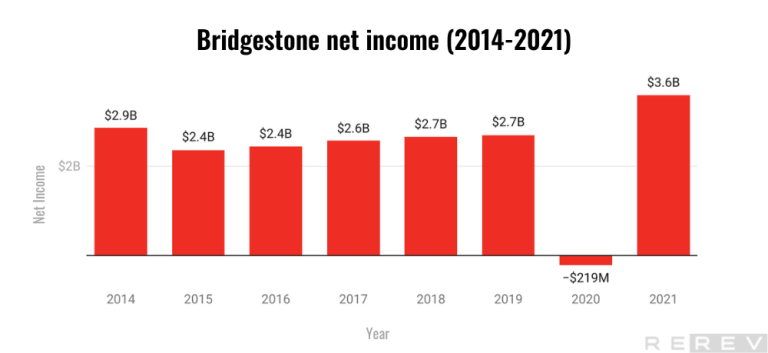
- Bridgestone’s net income fluctuate significantly, experiencing a significant net loss in 2020 but rebounding strongly with the highest net income in 2021.
The company’s net income experienced fluctuations from 2015 to 2019, with a general upward trend during this period. However, in 2020, the company faced a substantial net loss, which could be attributed to the economic impact of the COVID-19 pandemic. The situation dramatically improved in 2021, with the net income recovering and reaching its highest point in the given period. This indicates a strong financial turnaround for the company and demonstrates its resilience in the face of economic challenges.
Bridgestone R&D expenditure statistics
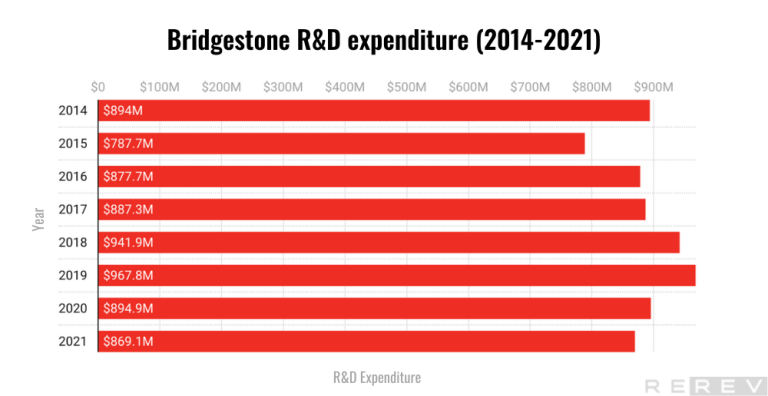
- Bridgestone’s R&D expenses have been relatively stable over the years. Despite fluctuations, the company’s R&D expenses have generally increased from 2015 to 2019 before slightly decreasing in 2020 and 2021.
From 2014 to 2019, there was a general upward trend in R&D spending, indicating that the company was investing in research and development to foster growth and innovation. However, the R&D expenses slightly decreased in 2020 and 2021, potentially due to the financial challenges brought on by the COVID-19 pandemic. Despite these reductions, the company’s R&D expenses in 2021 remained higher than those in 2015, suggesting that the company continues to value investment in research and development.
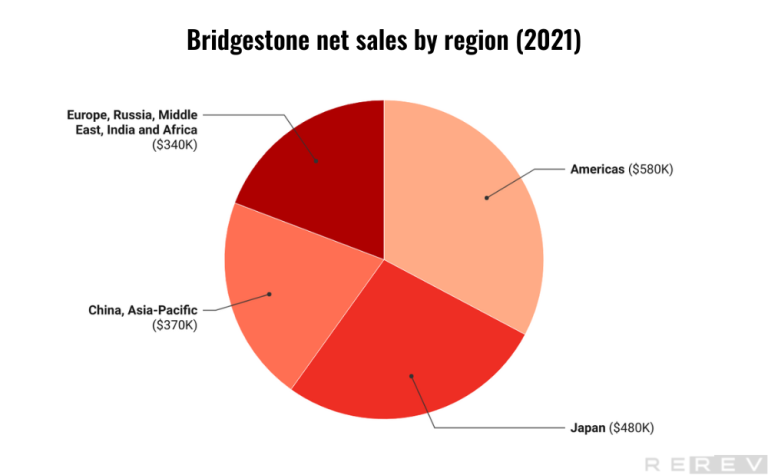
Bridgestone net sales by region statistics
- The highest net sales of Bridgestone generates the Americas region, while the China, Asia-Pacific region records the lowest net salesamong the four regions.
The Americas region leads with the highest net sales at $14,4 Billion, contributing significantly to the company’s overall revenue. Meanwhile, Europe, Russia, Middle East, India, and Africa form the second-highest net sales region with $7 Billion, followed by Japan with $5,1 Billion. The China, Asia-Pacific region records the lowest net sales at $4,2 Billion among the four regions.
Bridgestone global tire market share statistics
- Bridgestone holds the second-largest market share among tire brands at 12.5%, with Michelin leading the market at 14.8%.
Bridgestone is a significant player in the global tire market, holding a 12.5% market share, making it the second-largest tire brand. Michelin outpaces Bridgestone by holding the largest market share at 14.8%. Other competitors, such as Goodyear at 8.4%, Continental at 6.8%, and Sumitomo at 4.1%, possess smaller market shares. Brands like Pirelli, Hankook, and Yokohama also contribute to the market, but various other brands hold a large portion of the market share (36.6%).
Bridgestone manufacturing plants number by region statistics
- Bridgestone has a significant global presence with multiple manufacturing plants worldwide. Bridgestone has an equal number of manufacturing plants in the Americas and Japan (34 each), which are the highest among all regions.
Bridgestone boasts a substantial global manufacturing presence, operating a total of 114 plants distributed across various regions worldwide. The company has the highest number of manufacturing plants in the Americas and Japan, with 34 plants in each region. This demonstrates a strong focus on these key markets. In the China, and Asia-Pacific region, the company operates 29 plants, reflecting a significant presence in this growing market. The Europe, Russia, Middle East, and Africa region has the fewest manufacturing plants, with 17 facilities. Bridgestone’s widespread manufacturing capabilities highlight its commitment to meeting global demand and maintaining a robust supply chain across various markets.
Bridgestone number of R&D facilities by region statistics
- Bridgestone has a global R&D network with facilities located in multiple regions worldwide. The company operates a total of 16 R&D facilities globally.
Bridgestone’s commitment to research and development is evident from its 16 R&D facilities located across various regions. The company focuses on innovation and growth in the key markets of the Americas and, China, Asia-Pacific regions, where it has 5 facilities each. In Japan, Bridgestone operates 4 R&D facilities, while the Europe, Russia, Middle East, and Africa region has the fewest R&D facilities, with only 2. Bridgestone’s investment in R&D across different regions highlights its dedication to fostering innovation and developing cutting-edge products to stay competitive in the global tire market.
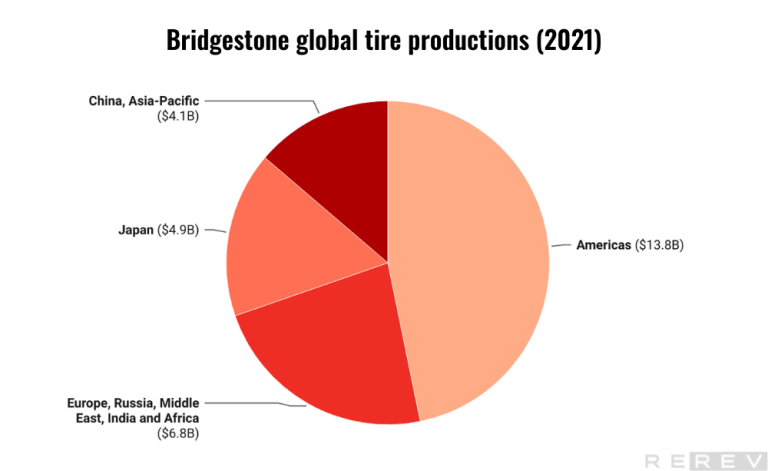
Bridgestone global tire production statistics
- Bridgestone’s tire production is heavily focused on the Americas, producing 13.82 billion units, which significantly surpasses the production levels in other regions, illustrating the company’s strategic prioritization of this market.
The tire production data for Bridgestone reveals a strong focus on the Americas region, where it produces 13.82 billion units, making it the largest production region for the company. Europe, Russia, Middle East, India, and Africa follow with 6.77 billion units, while Japan and China, Asia-Pacific produce 4.89 billion and 4.06 billion units, respectively. This information suggests that Bridgestone prioritizes the Americas market in terms of production capacity and could be leveraging this capacity to cater to the high demand in the region.
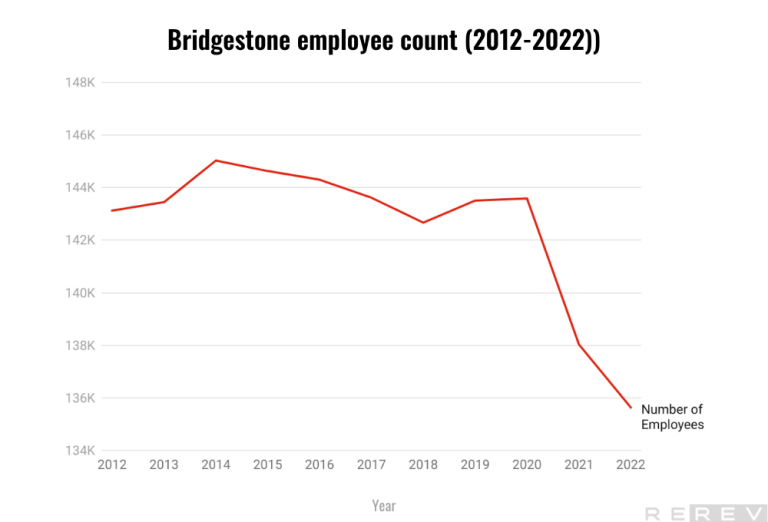
Bridgestone employee count statistics
- Bridgestone’s number of employees has slightly decreased over the years, with a noticeable decline from 143,589 in 2020 to 135,636 in 2022.
Bridgestone’s workforce has experienced a slight decrease over the years. While there were minor fluctuations in the number of employees from 2012 to 2020, there has been a more noticeable decline from 143,589 in 2020 to 135,636 in 2022. This reduction in the workforce could be attributed to various factors such as efficiency improvements, restructuring, or changing market conditions. Despite this decline, Bridgestone still maintains a sizable workforce, which highlights the company’s substantial presence in the global tire industry.
Bridgestone acquisitions & investments statistics

TomTom

Pep Boys

Car IQ

May Mobility

ClearMotion
- Bridgestone has been actively pursuing strategic acquisitions and investments to strengthen its position in the market and expand its capabilities.
Bridgestone has made several acquisitions and investments. Notable acquisitions include TomTom Telematics for €910 million in 2019, which could help enhance the company’s telematics offerings, and the purchase of Pep Boys for $863 million in 2015, which could expand its retail and service network. Additionally, Bridgestone has made significant investments in companies such as Car IQ, May Mobility, and ClearMotion, demonstrating its interest in innovative technologies and mobility solutions. These acquisitions and investments indicate Bridgestone’s commitment to staying at the forefront of the tire industry and exploring new opportunities for growth and diversification.
Bridgestone patents statistics
- Bridgestone has an extensive portfolio of 30,029 patent families, with the majority in Japan, highlighting the company’s strong focus on innovation and protecting its intellectual property globally.
Bridgestone’s impressive patent portfolio, totaling 30,029 patent families, demonstrates the company’s commitment to innovation and protecting its intellectual property in various markets worldwide. The majority of these patents are located in Japan, with 11,712 patents, followed by Europe with 5,518 patents, the United States with 4,329 patents, and China with 3,322 patents. Additionally, Bridgestone holds patents in other countries, including South Korea, the United Kingdom, and the Rest of the World.
Bridgestone emissions and waste statistics
- Bridgestone has been reducing its greenhouse gas emissions over the years.
There is a clear trend toward reduced greenhouse gas emissions and other pollutants between 2017 and 2020. Both Scope 1 and Scope 2 CO2 emissions have declined over the period, with the combined emissions (Scope 1 + Scope 2) dropping from 4,197,000 in 2017 to 3,162,000 in 2020. Scope 3 emissions have also decreased, falling from 128,884,000 in 2017 to 109,131,000 in 2020. Additionally, there has been a reduction in NOx and SOx emissions during this timeframe. This progress suggests that Bridgestone is actively working on implementing environmentally responsible practices and reducing its environmental footprint, contributing to global efforts to mitigate climate change and improve air quality.
Bridgestone stock & major shareholders statistics
- Bridgestone’s stock is listed on the Tokyo and Fukuoka stock exchanges under the code “5108,” with financial institutions and foreign entities holding the majority of shares, and the top five major shareholders owning around 39% of the total shares.
Bridgestone, with the stock code “5108,” is publicly traded on the Tokyo and Fukuoka stock exchanges. The company’s fiscal year runs from January 1 to December 31. Most of its shares are held by financial institutions (31.5%) and foreign institutions and individuals (28.5%). The annual shareholders’ meeting in March determines dividend payouts, and the share trading unit is 100 shares. With an authorized issuance of 1,450,000,000 shares, Bridgestone has issued 713,698,221 shares to date. The top five major shareholders, which include The Master Trust Bank of Japan, Ltd., Ishibashi Foundation, Custody Bank of Japan, Ltd., Hiroshi Ishibashi, and SMBC Nikko Securities Inc., collectively own approximately 39% of the total shares. The remaining shares are held by insurance companies, securities firms, and other entities, reflecting a diverse shareholder base.
Bridgestone financial summary statistics
- Bridgestone experienced a strong financial recovery from 2020 to 2022, with a significant increase in revenue and net income, alongside a decrease in total debt.
There is a remarkable turnaround in the company’s performance from 2020 to 2022. In this period, Bridgestone’s net income improved from a loss of 218 million USD in 2020 to a substantial positive figure of 3.59 billion USD in 2021 and 2.29 billion USD in 2022. This improvement is also reflected in the company’s revenue, which grew from 25.24 billion USD in 2020 to 29.56 billion USD in 2021 and 31.27 billion USD in 2022. Furthermore, Bridgestone managed to reduce its total debt from 9.76 billion USD in 2020 to 7.05 billion USD in 2021 and 5.85 billion USD in 2022. This data suggests that Bridgestone has not only recovered from previous financial setbacks but is also experiencing growth and making progress in reducing its debt.
Bridgestone corporate rating statistics
- Bridgestone’s strong credit ratings from major agencies reflect its financial stability and solid credit standing, making it an attractive investment option for corporate bond investors.
Bridgestone has earned favorable credit ratings from four major credit rating agencies, which is a testament to the company’s financial stability and strong credit standing. Moody’s has assigned an A2 rating, while S&P, R&I, and JCR have given A, AA+, and AA+ ratings, respectively. These high credit ratings indicate that Bridgestone is well-positioned to fulfill its financial obligations and has relatively low credit risk. As a result, investors seeking opportunities in corporate bonds may consider Bridgestone a suitable investment option.
Bridgestone business plan statistics
- Bridgestone aims to become a sustainable solutions company by 2050, with a focus on increasing revenue from its solutions business and reducing CO2 emissions.
Bridgestone is working towards becoming a sustainable solutions company by 2050, with a mid-term business plan for 2021-2023 focusing on aggressive approaches and challenging financial goals. The company aims to achieve a 40% gross profit ratio and a revenue target of JPY 3,300 billion by 2023. They plan to improve sales quality through increasing premium tire products, expanding their solutions business, and diversifying product offerings. Bridgestone aims to reach a 13% adjusted operating profit ratio, equivalent to JPY 450 billion by 2023. The company has set ambitious sustainability targets, including reducing CO2 emissions by 50% (vs. 2011) and using 40% recycled and renewable materials by 2030, ultimately achieving carbon neutrality and 100% sustainable material usage by 2050. This strategy will help build a resilient and highly profitable structure, enabling Bridgestone to invest in new businesses from 2024 onwards.
Sources
- “Shareholder Information”. Bridgestone, 2022, https://www.bridgestone.com/ir/shareholders_information/stockinformation/index.html
- “Sustainability Report 2020”. Bridgestone, 2020, https://www.bridgestone.com/responsibilities/library/pdf/sr2020.pdf
- “Bridgestone’s Operating Results”. Statista, 2021, https://www.statista.com/statistics/224738/bridgestones-operating-results/
- “Financial Data”. Bridgestone, https://www.bridgestone.com/ir/financialdata/results/
- “Bridgestone History”. Bridgestone, https://www.bridgestone.com/corporate/history/
- “Corporate Library”. Bridgestone, https://www.bridgestone.com/corporate/library/
- “Corporate Brochure”. https://www.bridgestone.com/corporate/library/brochure/index.html
- “Corporate Brochure (PDF)”. Bridgestone, https://www.bridgestone.com/corporate/library/brochure/pdf/cb_e.pdf
- “Integrated Report”. https://www.bridgestone.com/ir/library/integrated_report/index.html
- “Integrated Report (PDF)”. 2022, Bridgestone, https://www.bridgestone.com/ir/library/integrated_report/pdf/ir2022_07_spread.pdf
- “Bridgestone Data Book”. https://www.bridgestone.com/corporate/library/data_book/index.html
- “Bridgestone Data Book (PDF)”. Bridgestone, 2023, https://www.bridgestone.com/corporate/library/data_book/pdf/BSDATA2023.pdf
- “Annual Report”. Bridgestone, https://www.bridgestone.com/corporate/library/annual_report/index.html
- “Annual Report – Operational Review (PDF)”. Bridgestone, 2020, https://www.bridgestone.com/corporate/library/annual_report/pdf/bs_annual_2020_operational.pdf
- “Annual Report – Financial Information (PDF)”. Bridgestone, 2020, https://www.bridgestone.com/corporate/library/annual_report/pdf/bs_annual_2020_financial.pdf
- “Responsibilities Library”. Bridgestone, https://www.bridgestone.com/responsibilities/library/
- “Sustainability Report 2020”. Bridgestone, 2020, https://www.bridgestone.com/responsibilities/library/pdf/sr2020.pdf”